Oregon Crash Data
Safer Roads Through Education
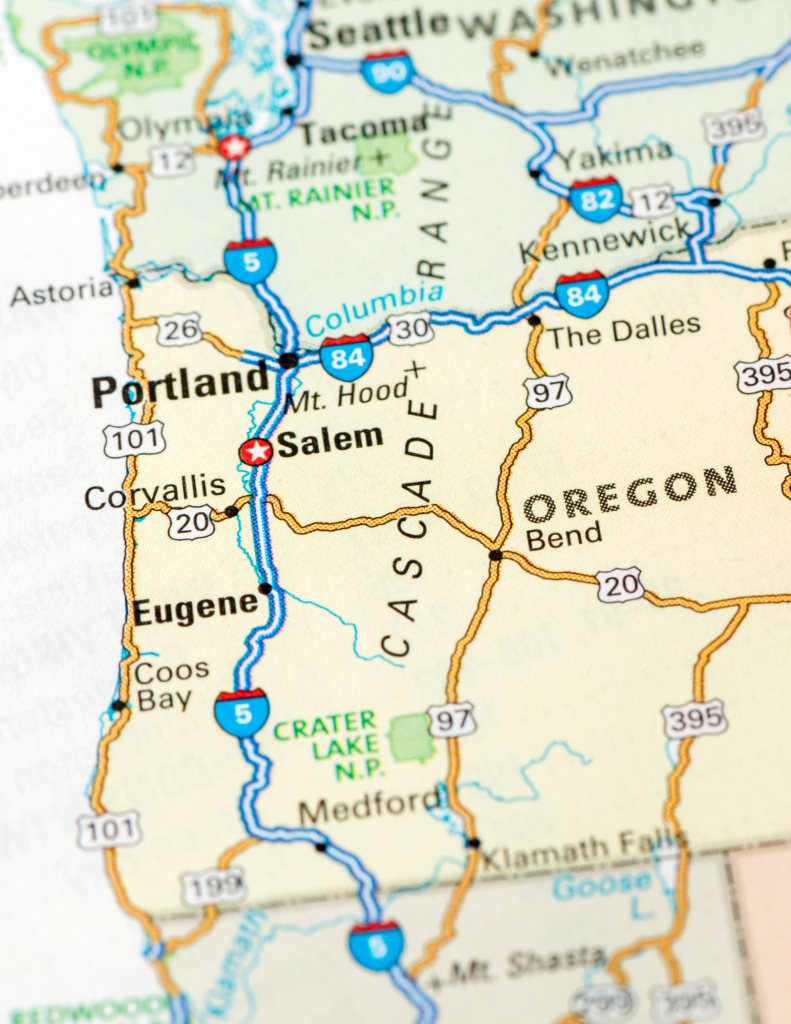
Statewide Crash Distribution 2016-2021 Fatal and Serious Injury Crashes
Oregon has the 8th highest traffic fatality rate in the country – with 1.45 roadway deaths for every 100 million miles traveled, according to data from the first half of 2022 from the National Highway Traffic Safety Administration. (Source: IIHS 1996-2025, Insurance Institute for Highway Safety, Highway Loss Data Institute, 501(c)(3) organizations)
From 2002-2006 there were 48 deaths involving people walking. Compared to 2018-2022 with 91 deaths. That’s a 89.6% increase. We can do better to make our roads safe for all people.
People walking are injured at roughly 16 times the rate of motor vehicle occupants and people on bikes are injured at roughly 8 times the rate of motor vehicle occupants.
Source: 2008 – 2012 ODOT Crash Data System & Oregon Household Activity Survey
Crash Statistics & Reports
Data from the Oregon Department of Transportation
Oregon Department of Transportation (ODOT) crash data reports paint a sobering picture of the risks faced by vulnerable road users. These reports reveal a consistent trend of preventable crashes involving people walking, biking, and using electric mobility devices, highlighting the critical need for enhanced driver awareness and skill.
The Oregon Friendly Driver course directly addresses this need by providing comprehensive education on safe road sharing practices, Oregon-specific traffic laws, and defensive driving techniques. By understanding the common causes of these crashes and learning how to anticipate and react to potential hazards, drivers can play a vital role in reducing these tragic incidents and creating safer roadways for everyone.
This course is not just about avoiding citations; it’s about saving lives and fostering a culture of respect and responsibility on Oregon’s roads.